Create Professional Flowcharts in 10 Minutes, Not Hours
Skip the frustration of manual diagram creation. Learn a simple 3-step method to create professional flowcharts in minutes using Claude and draw.io, perfect for technical documentation and client presentations.
When Diagrams Became a Bottleneck in My Workflow
Ever found yourself staring at a blank canvas in a diagramming tool, struggling to align boxes and arrows for a client presentation? I’ve been there more times than I care to admit.
After spending three frustrating hours creating a customer lifecycle diagram last week—repeatedly nudging elements into place, fixing broken connections, and tweaking colors—I realized there had to be a better approach. That’s when I discovered a method that transformed a tedious half-day task into a 10-minute process.
In this guide, I’ll share my straightforward technique that uses the combined power of AI (specifically Claude) and draw.io to create professional flowcharts without the usual headaches.
Why Traditional Diagramming Is So Frustrating
Traditional diagramming tools put all the design burden on you. You’re responsible for:
- Planning the layout
- Creating and positioning each element
- Connecting everything correctly
- Ensuring proper spacing and alignment
- Making consistent style choices
This manual process doesn’t scale well when you’re managing complex client projects, especially when you need to iterate quickly based on feedback. After creating dozens of technical diagrams for projects ranging from automated data flows to form handling systems, I’ve developed a more efficient approach.
The 3-Step Method to Create Flowcharts in Minutes
The secret is splitting the process into logical thinking (what the diagram should show) and visual execution (how it should look). Here’s how it works:
Step 1: Use Claude to Generate the Diagram Code
- Navigate to Claude (or your preferred AI assistant)
- Provide a prompt that describes your diagram needs in detail
Here’s the exact prompt I used for my customer lifecycle diagram:
Create a horizontal flowchart showing a B2B customer lifecycle with:
* Contact phase (Initial contact and form submission)
* Analysis phase (Free assessment)
* Conversion phase (Proposals)
* Delivery phase (Service and management)
* Retention phase (Reviews and renewals)

Make it:
* Left to right
* Include subgroups
* Add brief notes
* Show renewal loops
* Use Mermaid syntax
* Keep it business-neutral
Notice how the prompt focuses on what the diagram should show (structure and content) rather than visual details. This separation of concerns is crucial for efficiency.
- Claude will generate the diagram structure in Mermaid.js code—a simple text-based diagramming language. Here’s a simplified example:
graph LR
    A[Contact Phase] --> B[Analysis Phase]
    B --> C[Conversion Phase]
    C --> D[Delivery Phase]
    D --> E[Retention Phase]
E --> C - Claude’s preview feature will show you a basic rendering of the diagram. Use this to verify the structure before proceeding.

Pro Tip: You can ask Claude to refine the diagram structure if needed. For example: “Add a decision point between Analysis and Conversion phases” or “Create a parallel path for return customers.”
Step 2: Use draw.io to Visualize the Diagram
Now that you have the logical structure defined, it’s time to render it with professional styling:
- Open a new tab and navigate to draw.io (a powerful free diagramming tool)
- When prompted for storage location, click “Decide later”—we’re just using it for conversion

- Go to Arrange > Insert > Advanced > Mermaid—this is where the magic happens

- Paste the Mermaid.js code generated by Claude into the input field

Step 3: Customize and Export Your Professional Diagram
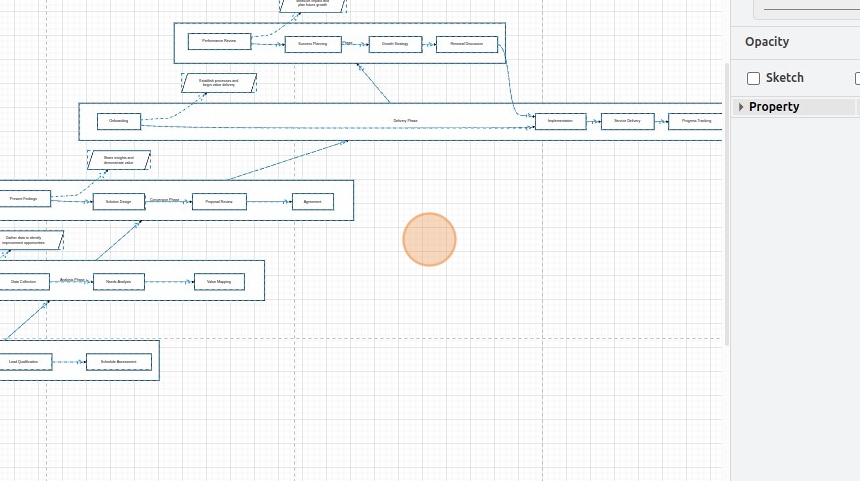
- Click “Insert” to render the diagram with draw.io’s professional styling

- Voilà! You now have a professionally formatted diagram that looks like it took hours to create
-
You can now make fine adjustments to the layout if needed, though I’ve found the automatic rendering works beautifully in most cases
-
Export your diagram in your preferred format. For client-facing deliverables, I recommend:
- SVG: For web use and perfect scaling
- PNG: For presentations and documents with transparent background
- PDF: For print materials

- Want to match your client’s brand colors? Use draw.io’s style options to adjust the color scheme before exporting

Why This Approach Works So Well
This method leverages the strengths of both AI and specialized diagramming tools:
- Separation of concerns: Structure is defined textually, while visual presentation is handled by draw.io
- Rapid iteration: Need changes? Just modify the Mermaid code and re-import
- Automatic layout: The Mermaid renderer handles the complex task of element positioning
Real-World Applications Beyond Flowcharts
While I initially developed this technique for client lifecycle diagrams, I’ve since applied it to numerous other technical documentation needs:
- System architecture diagrams for automation workflows
- Decision trees for complex business logic
- Data flow models for form processing systems
- Process maps for project documentation
- Organizational charts for team responsibilities
- User journey maps for UX presentations
The same technique works for all these diagram types—simply adjust your prompt to Claude accordingly.
Advanced Tips for Power Users
Once you’re comfortable with the basic workflow, try these advanced techniques:
Customize Your Mermaid Syntax
Mermaid offers rich capabilities beyond basic flowcharts. You can add:
- Styling:
style A fill:#f9f,stroke:#333,stroke-width:4px - Subgraphs: Group related elements visually
- Links: Add clickable links to elements
- Comments: Include notes for complex sections
Create a Diagram Library
For recurring client work, build a library of common diagram structures:
- Save the Mermaid code snippets in a searchable note system
- Document variations for different use cases
- Create templates you can quickly adapt for new projects
Incorporate Stakeholder Feedback Efficiently
When clients request changes:
- Update only the Mermaid code that needs changing
- Re-import to draw.io
- Export the new version
This approach ensures you’re spending time on thoughtful diagram structure rather than fiddling with visual elements.
Conclusion: Diagrams Should Enhance Your Work, Not Delay It
Creating professional diagrams shouldn’t be a bottleneck in your workflow. Using this AI-powered approach, you can produce client-ready visuals in minutes rather than hours, allowing you to:
- Deliver more polished client presentations
- Improve technical documentation
- Communicate complex concepts clearly
- Iterate quickly based on feedback
This method perfectly embodies my philosophy for technical solutions: automate the tedious parts, focus your energy on the aspects that add real value, and maintain complete control over the final output.
Have you tried this approach or developed other diagram creation shortcuts? I’d love to hear about your experiences in the comments.
For more productivity techniques that save hours of work, check out my guides on setting up n8n for automation workflows and creating form systems for static websites.